Ogive Graph

Ogive is a plot of cumulative values. It can be used to determine how many data values lie above or below a particular value, so it is easy to find the middle or a quarter of the data set from ogives. Ogives are also used in computing the percentiles of the data set values. e.g A 95th percentile says that 95% of the time data points are below that value and 5% of the time they are above that value.
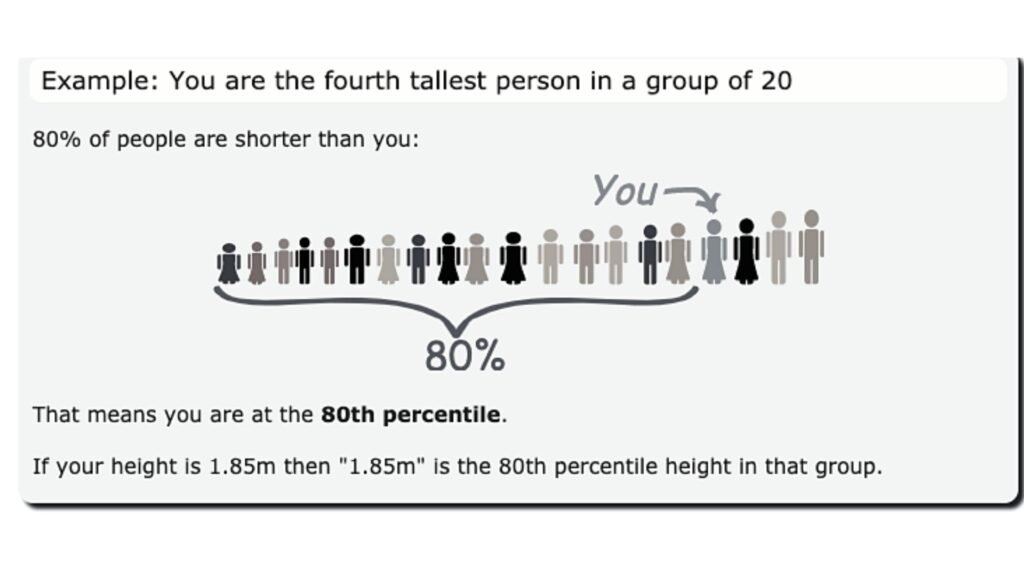
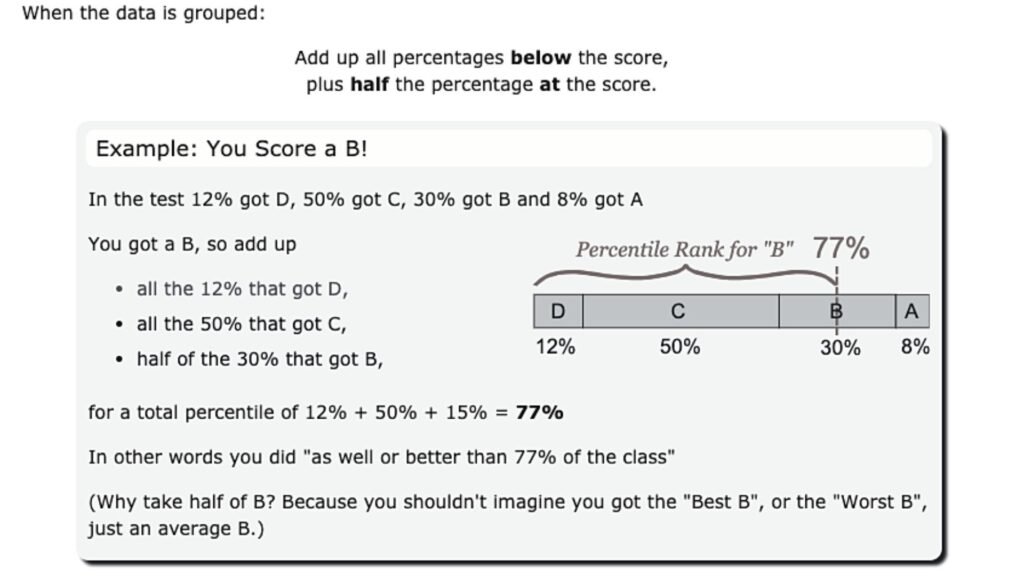
The 25th percentile is also called the lower or first quartile (Q1). The 50th percentile and 75th percentile are called the second quartile (Q2) and third quartile (Q3). The third quartile is also known as the upper quartile. The second quartile is also known as the median. The difference between the third and first quartiles is known as the inter-quartile range. The inter-quartile range is also a measure of the spread of the data. Using the definition of percentile above, half of the sample size is found inside the inter-quartile range.
How to calculate cumulative percentage?

A cumulative percentage is calculated by dividing the cumulative frequency by the number of observations, n, then multiplying by 100 (the last value will always be equal to 100%). Thus: CUMULATIVE PERCENTAGE = CUMULATIVE FREQUENCY / n x 100
Now from Ogives, we can know the central point so that 50% of the observations are below this point and 50% above. To do this, we draw a line from the point of 50% on the axis of percentage until it intersects with the curve. Then we vertically project onto the horizontal axis to get the value. Example: Calculate the cumulative percentage and hence draw a graph with two different vertical axes: one for cumulative frequency and one for cumulative percentage.

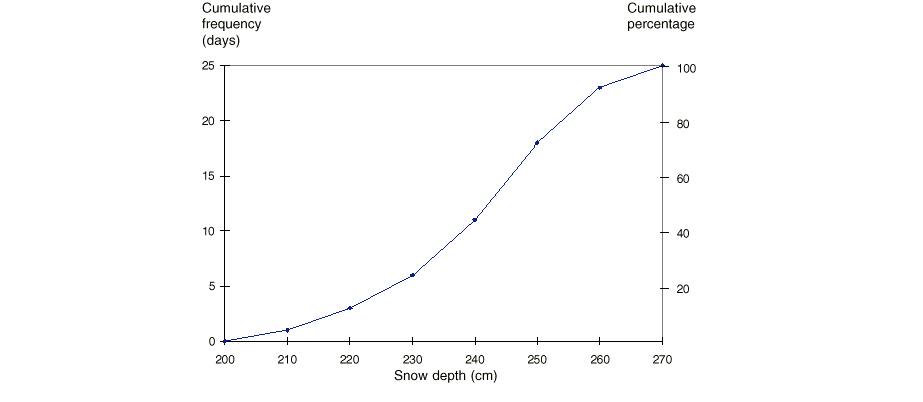
For information on Ogive – more than ogive and less than ogive, click on the below video:
Like the article? Share and spread the knowledge


